
In the world of Investments, perspective is everything. Some analysts and firms focus on one or two factors for when preparing a company valuation. They might lean on certain financial ratio’s or compare a company to the rest of the firms in that same industry. Regardless of the process for establishing valuation, one thing is clear: It might be time to take a step back and look at the larger picture.
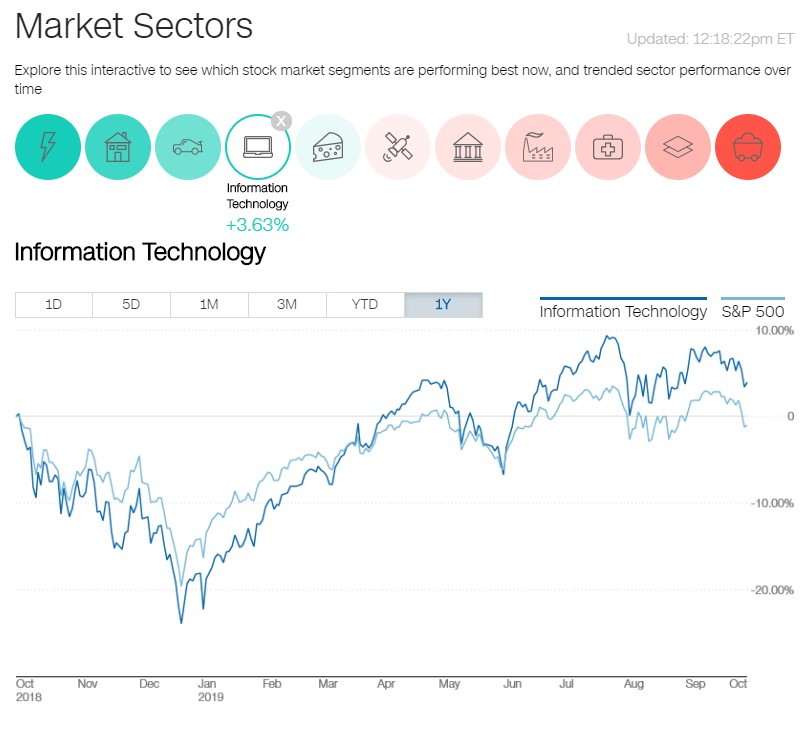
As I was preparing a sector analysis, I noticed something interesting. When comparing sectors on a year to date basis, the returns showed very high overall results, as seen below (for full graph check out https://markets.money.cnn.com/Marketsdata/Sectors/InformationTechnology )

According to the above chart, the information technology sector, year to date, is up almost 27%. Now that isn’t that surprising considering companies like Google (GOOGL) and Facebook (FB) are in this industry. However, I was surprised to learn that over the last 12 months, just a couple months before this chart, this sector is only up approximately 3.63%.
The same scenario played out for all the sectors leading the market. As I was researching, an interesting article from Bloomberg was posted which described performance of the S&P 500 since 2018. According to report, since January of 2018 the market has gained almost no ground. It’s hard to believe after such a tumultuous few years of never-ending rallies and market corrections that we are no better off then we were almost 2 years ago.

After reading the article, I decided to investigate the numbers myself. I pulled the data from Yahoo! Finance myself and created a quick graph (Not glamorous I know) to show how things have moved over the last 23 months. The price of the S&P 500 on January 31, 2018 was 2832.41 is very close to todays open of 2885.38. As I noted in my graph, there seems to be a resistance line that the market can’t grow beyond. It appears that every time the market gets over the 2830-mark, market forces (or nonsensical tweet) push it back down.
Now, this may not be groundbreaking research, but I thought that maybe the performance in the S&P 500 might reflect consumer confidence. So, I submit to the jury the following Hypothesis: If the economy is starting to run out of fuel, could we be closer to a recession than we think? If so, what would be the outward signs? I decided to try and answer these questions by comparing what has transpired over the last 90 days.
Yield Curve
First, there was the recent yield curve inversion. The inversion is when shorter term bonds were paying more than longer term ones. This is very different than one would think, most of us would require a higher yield for keeping our money for a longer period. At the end of August, the 10-year yield curve dipped below the 2-year yield, meaning you can receive a higher yield to maturity for a 2-year bond than you would for a 10-year bond. The inversion gives indications of issues weeks or months prior to a recession but is usually a sign of shaky consumer confidence in the long term. The graph below from the Federal Reserve Bank of St. Louis shows the inversion below.

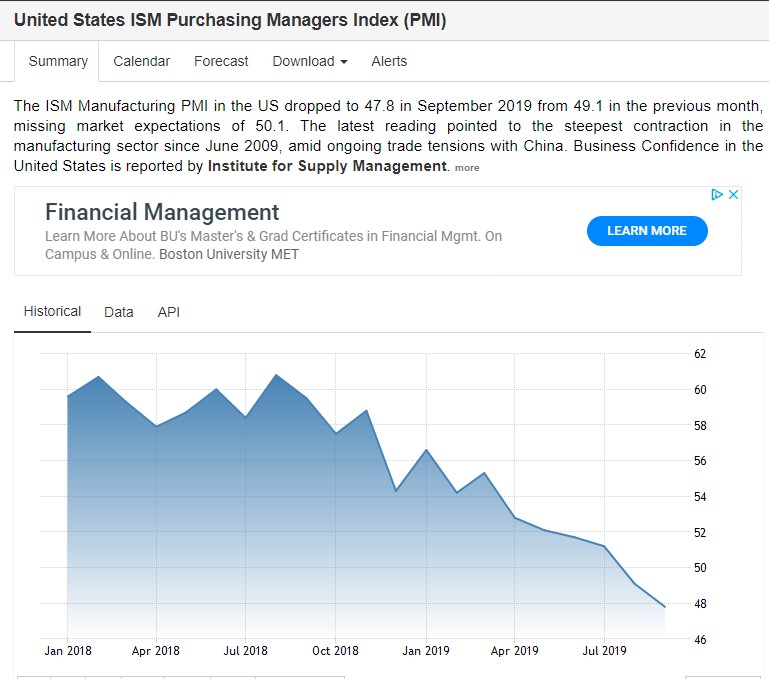
PMI
Another common sign of recession, but less talked about is the Purchasing Managers Index or PMI (shout out to Mr. Lopes). To best explain what PMI is, I will let Investopedia explain. PMI “… is an index of the prevailing direction of economic trends in the manufacturing and service sectors. It consists … of an index that summarizes whether market conditions, as viewed by purchasing managers, are expanding, staying the same, or contracting. The purpose of the PMI is to provide information about current and future business conditions to company decision makers, analysts, and investors.” Balanced levels of the PMI are 50, with lower levels showing a contraction of the manufacturing industry and above 50 showing signs of expansion. Currently, we are at 47.8, the lowest levels since 2009.
Global Growth
Now, could all of this data just be speculation? Anything is possible but considering that in addition to questions about a US recession, global growth is also starting to become an issue. In recent weeks, China announced that its GDP growth is the lowest it has been in decades. Under Prime Minister Narendra Modi, India has also had its GDP growth reduced, cut from 7% down to 6%.
Corporate Debt
My last piece of evidence is the ever-increasing corporate debt levels that I have noticed in companies like Netflix (NFLX). Netflix has been adding a ridiculous amount of debt to keep up with competitors entering the streaming space. Even Apple (APPL) is jump on the debt band wage. Who, last month issued over 7 Billion of new corporate debt. This is most likely due to relatively low interest rates and accessibility of credit. However, Netflix and Apple are not alone. A recent Financial Times article wrote, “Companies around the world sold a record amount of bonds last month, taking advantage of low borrowing costs fueled by investors’ frenzied search for yield.”

Jobs Report
It is also worthy to note that we await the jobs report which will show the creation of new jobs last month. All signs point to a less than stellar report.
Conclusion
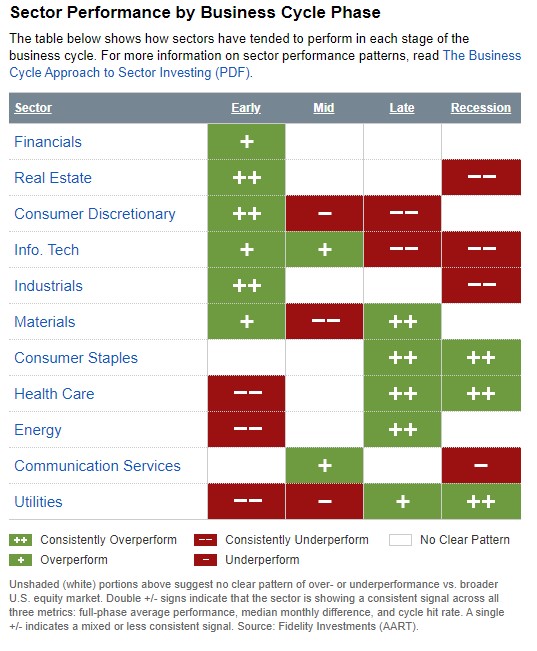
So, it appears that all signs point to a recession, sooner rather than later. According to Fidelity, their research shows that the US economy is squarely in the late stages of the business cycle. Now, granted this is as of June 2019, but if anything, it might be closer to the recession than anything else.
With hints of a recession around every corner, I thought this last picture would be useful. Fidelity did the research and to show us what sectors tend to overperform or underperform depending on what stage of the business cycle we are in. Although this is by no means a crystal ball. It might help give some direction for those who fear the reaper (Blue Öyster Cult reference). However, if the end is nigh, we can always invest in commodities like gold (although gold has jumped to a six-year high) or just stuff all our retirements under out mattresses and hopefully wait it out.
References
fbclid=IwAR2rQDzDy1bv4G5rTdIhiqXbFR6Dv0iyrt1UmqwHqLbKqE-N_4g94CkNCps
https://www.investopedia.com/terms/p/pmi.asp
https://tradingeconomics.com/united-states/business-confidence
https://eresearch.fidelity.com/eresearch/markets_sectors/sectors/si_business_cycle.jhtml?tab=sibusiness
https://markets.businessinsider.com/news/stocks/why-apple-sold-debt-despite-having-lots-of-cash-2019-9-1028503164
https://www.ft.com/content/eef8234c-e3c0-11e9-b112-9624ec9edc59
