
As the bell rings to signify they start of trading for the 4th quarter, it is the perfect time to look back at some of the market leaders over the last quarter and year to date. However, just to help clear up any confusion, the article and chart below describe sectors of S&P 500 Index. However, in order to understand the content, lets break this down a little further.
This index is comprised of 500 different publicly traded companies. As seen below, these companies are essentially broken down into 11 different categories based on the services they provide. Most are self evident, such as the energy sector or healthcare, but some might require more clarification. Consumer discretionary sector, for example, consists of companies that ” markets goods or services to people with money to spend over and above their baseline needs” (fool.com).
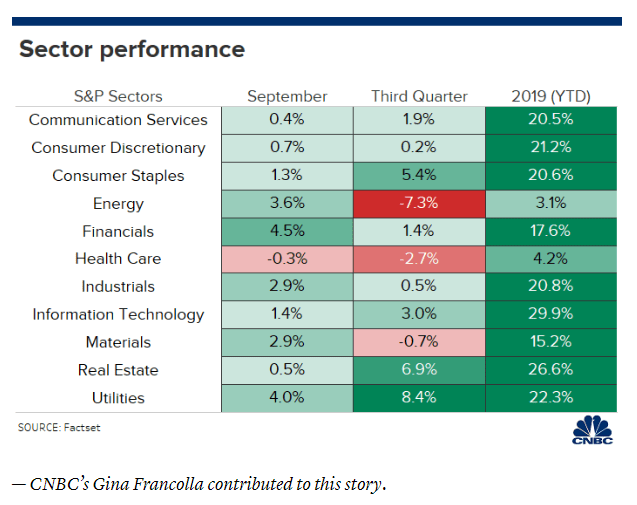
Now that we have covered the basics, CNBC posted a great article this morning showing what sectors are leading and which are lagging. I have included the below chart from said article. It shows that in the third quarter, which just ended on Monday, the energy and health care sectors were the biggest losers. However, year to date, all of the sectors are up.
The reason I think this is important is that, I feel that the market is largely overvalued. With economic indicators such as the yield curve inverting and slowing growth in global economies, I feel need to be realistic on our valuations and how we invest. Stay tuned later on today, I will be finishing up some research on my own sector analysis and outlook for the rest of the year.
https://www.cnbc.com/2019/09/30/investors-rotated-into-these-top-sectors-in-september.html
https://www.fool.com/investing/10-biggest-consumer-discretionary-stocks.aspx
